Employment Statistics
The US labor market often feels like a whirlwind of ups and downs - projecting to grow considerably one minute and tanking the next.
While no one (that I know of) has a crystal ball that can predict what’s to come, there are data points we can utilize to help paint a better picture of our work world.
We have compiled a few key employment statistics, packaged them into infographics and graphs, then added them to this article.
US Employment Infographics
-
Projected change in employment infographic
-
Lowest unemployment rate by state infographic
-
Percentage wage increase chart
-
Job quit rate chart
US EMPLOYMENT STATISTICS
Projected Change In Employment Infographic
With the constant need for talent within critical industries such as healthcare and business, there’s no wonder they continue to grow rapidly.
Below, we have listed the projected change in employment in the United States from 2020 to 2030 by primary industry. - Statista

Related:
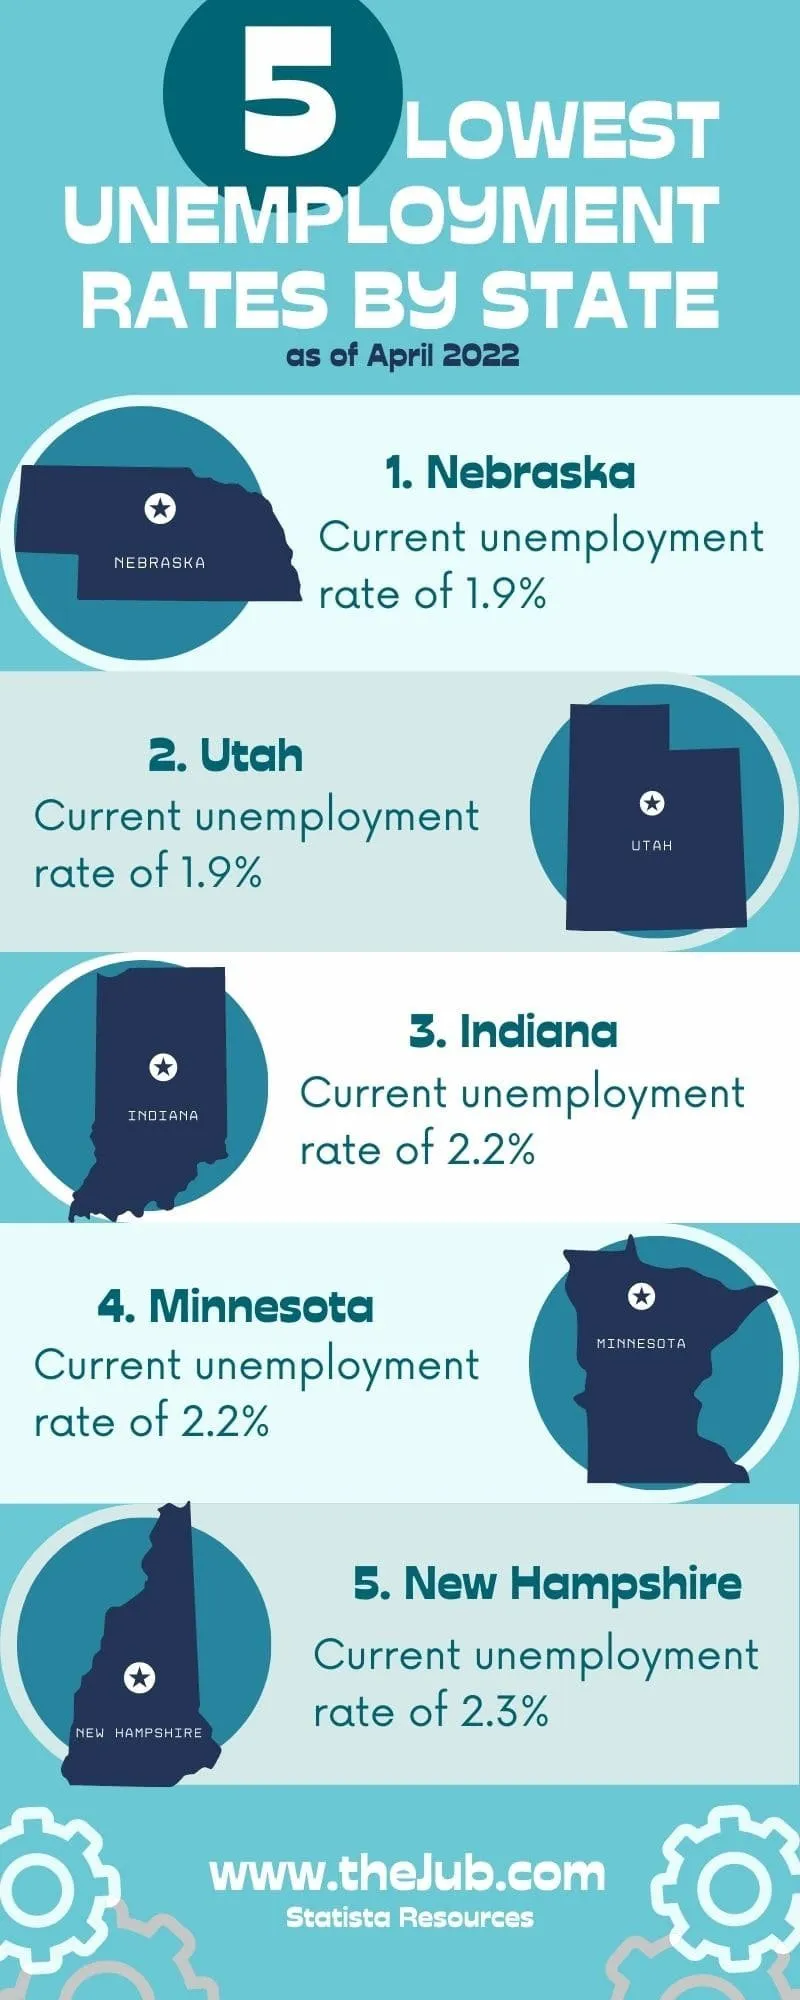
Lowest Unemployment Rates By State Infographic
Unemployment seems to hit certain states and industries much harder than others. As of April 2022, the states with the highest unemployment rates are here.
-
District of Columbia (5.8%)
-
New Mexico (5.3%)
-
Nevada (5%)
-
Alaska (4.9%)
-
Pennsylvania (4.8%)
And in the infographic below, we run through the five states doing pretty well in this category. - Statista

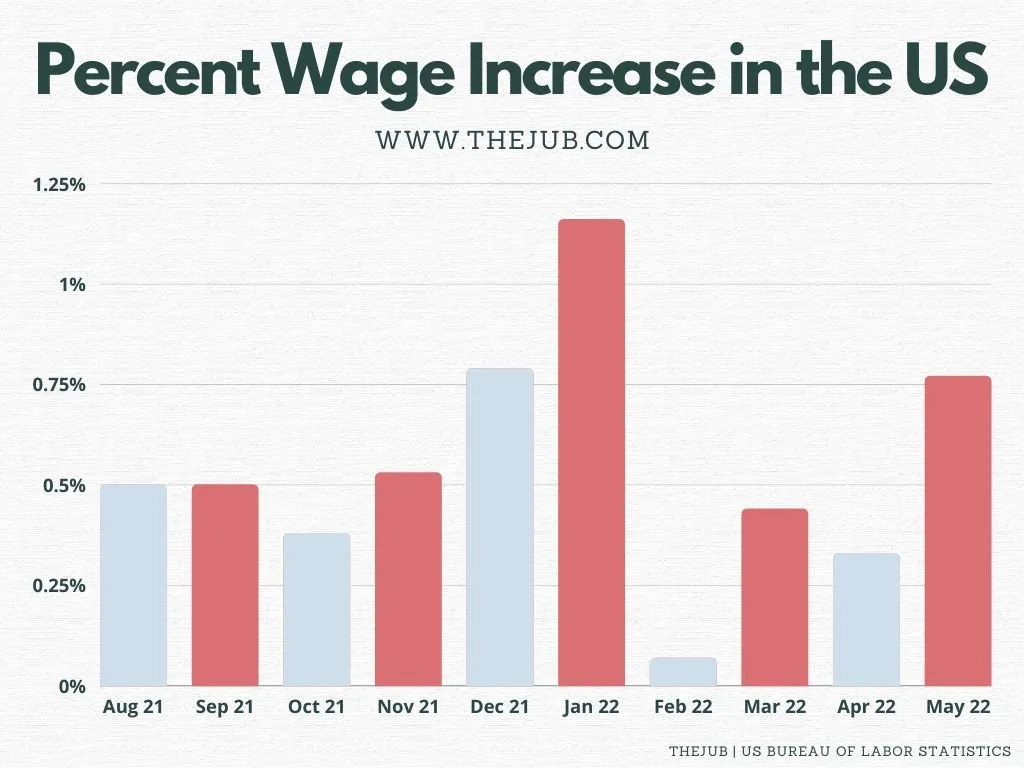
Percent Wage Increase In The US
While wages tend to increase overall, some months do much better than others. Below is a chart listing the percent wage increase in the US by month. - BLS

Related:
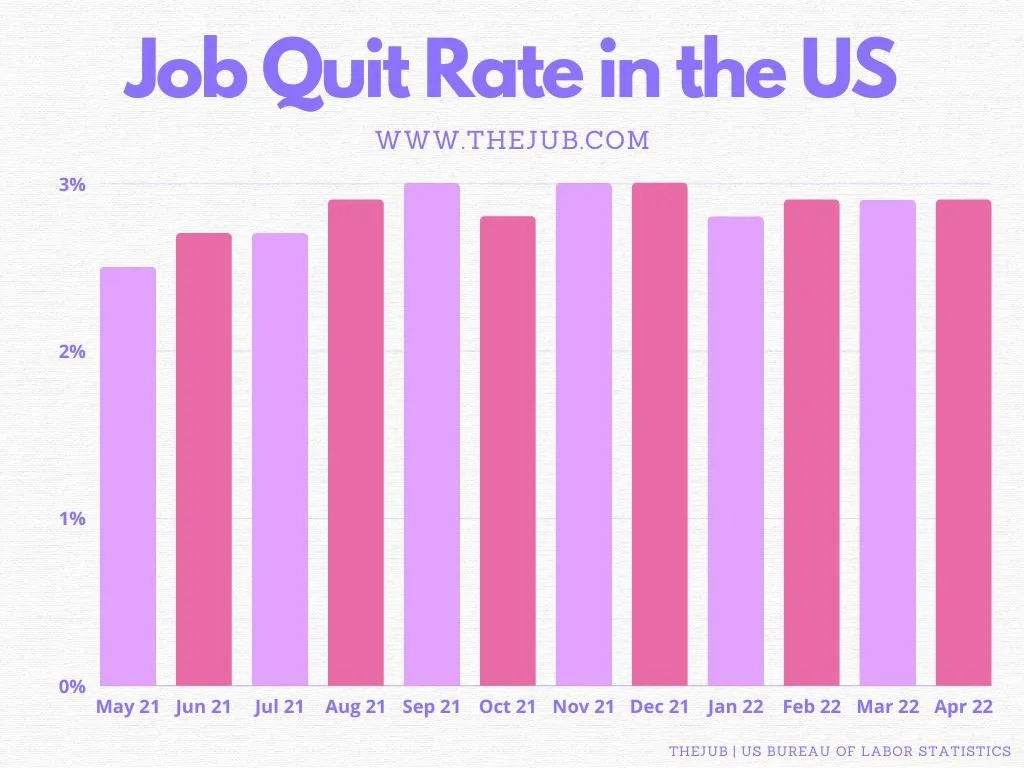
Job Quit Rate In The US
Job quits are considered voluntary separation of the employee from their place of employment (retirement is not part of this metric).
The quits rate is the number of quits during the entire month as a percent of total employment. - BLS

Title: US Employment Stats 2022
Category: Employer Resources
Tags: us unemployment data, state unemployment rate, us employment growth by industry, employment stats, us jobs report, jobs quits rate in the us, wages increase in the us, us employment statistics
Author: Reid is a contributor for theJub. He's an employment and marketing enthusiast who studied business before taking on various recruiting, management, and marketing roles. More from the author. | Author Profile


